Getting a Quick Start with NerveCenter
-
Monitoring Alarms - Viewing Alarm Instances -
Monitoring Alarms
Analyzing Historical Detail for an Alarm Instance
Viewing Alarm Instances
NerveCenter displays information about current alarm instances in the Alarm Summary window. If your network later includes more than one NerveCenter Server, you can use the Aggregate Alarm Summary window to view alarm instances from all servers at once. For now, you will use the Alarm Summary window, which displays alarm instances for one server at a time.

To open the Alarm Summary window:

 From the client's
 Admin menu, choose Alarm Summary.
The Alarm Summary window is displayed.
The Tree View
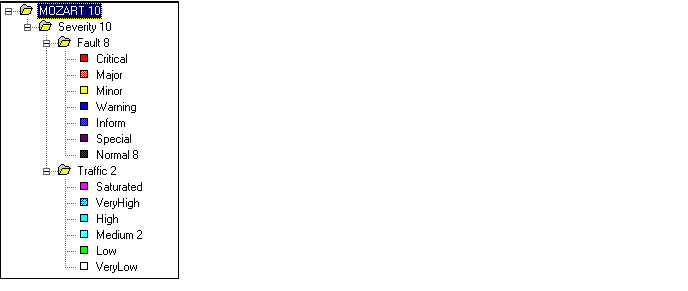
The left pane contains a tree that displays the total number of current alarm instances, the number of instances in each severity group (Fault and Traffic), and the number of instances of each severity. If there is no number next to a severity, there are no active alarm instances of that severity.
Alarm Summary Tree shows a sample tree.
Alarm Summary Tree


To view information in the tree:
- To expand a level and display the items within it, select the [+] next to the folder you want to expand.
- To view information for any level -- for example, all instances in the Fault folder or all instances of a particular severity -- select the level. The information is displayed in the right pane.
The Alarm Detail View
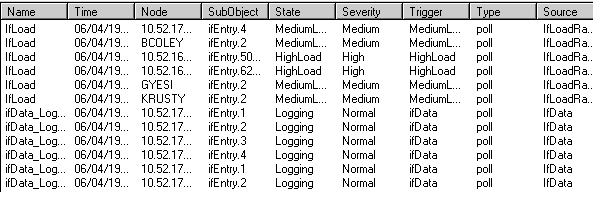
The right pane provides detailed information about each current alarm instance related to the folder that is highlighted in the tree view. You can monitor the IfData_LogToFile and IfLoad alarm instances using the detail view.
Alarm Summary Detail

As mentioned earlier, the ifLoad alarm reverts to its originating state when a low load condition is detected. This causes the corresponding alarm instance in the Alarm Summary window to disappear. If the node's load decreases during a poll and resets its alarm instance, you can cause another alarm instance by restarting one or two applications on the node.
Fields in the Alarm Detail Pane explains what information is available for each alarm instance.
Fields in the Alarm Detail Pane
|
Column
|
Description
|
|---|
Name |
The name of the alarm from which the alarm instance was created. |
Time |
The time at which the alarm instance's most recent transition occurred. |
Node |
The host name or IP address of the node the alarm instance is monitoring. |
SubObject |
The subobect associated with the alarm instance. The subobject consists of a MIB base object plus an instance number -- for example, ifEntry.1. The instance often tells you which interface on a device is being monitored. |
State |
The current state of the alarm instance. The name of the state should indicate the condition NerveCenter is reporting. For example, an IfLoad instance might be in the Medium or High state. |
Severity |
The severity of the alarm instance's current state. |
Trigger |
The name of the trigger that caused the most recent alarm transition. |
Type |
The type of trigger that caused the most recent alarm transition. So far, you've worked only with alarms that are triggered by polls. Some other possibilities are mask and alarms. |
Source |
The name of the object that generated the trigger. |
The alarm detail pane is designed primarily for viewing. However, you can perform a couple of actions from this pane:


